Per-acre budget calculator
Crop Budget Calculator
For farmers who want a per-acre cost, revenue, and breakeven read on a crop before they commit seed, fertilizer, and cash to the field.
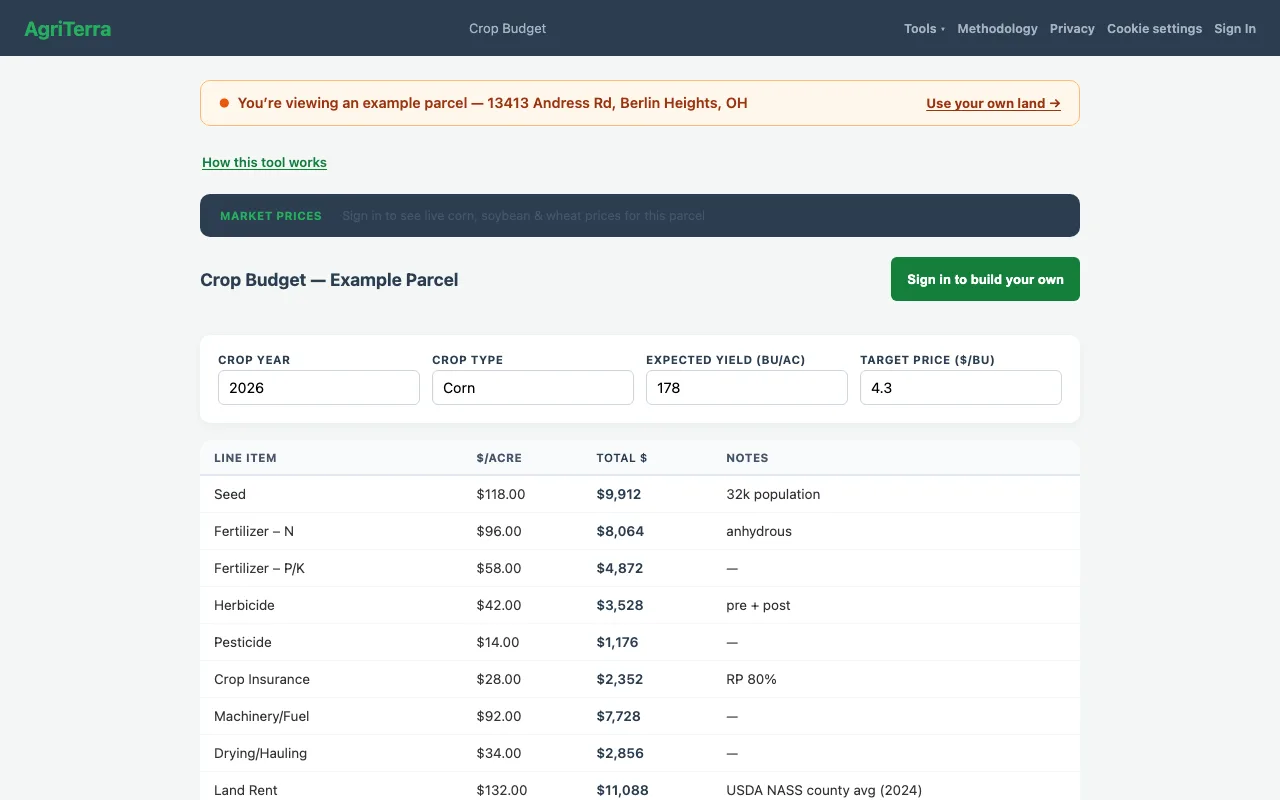
The AgriTerra Crop Budget Calculator is a free tool that builds a per-acre budget for a crop on any U.S. parcel (costs on one side, projected revenue on the other) and shows your net return and breakeven before you spend on inputs. It is built for farmers and landowners planning a season, and its defaults come from USDA ERS cost-of-production figures and USDA NASS pricing, every one of which you can override with your own numbers.
How the calculator works
- Pick a parcel and a crop. Start a new budget scenario for the field you’re planning and choose the crop: corn, soybeans, wheat, or another the parcel supports.
- Start from USDA cost defaults. The calculator pre-fills seed, fertilizer, chemical, fuel, and operating costs from USDA ERS Commodity Costs & Returns for that crop and region, so you’re not starting from a blank sheet.
- Override with your real numbers. Every line is editable. Drop in your actual seed price, your fertilizer program, your custom-hire or machinery costs. The budget is meant to become your budget.
- Set yield and price. Enter your expected yield and a cash price; state cash bids and basis help you land a realistic local price rather than a distant futures number.
- Read net return, breakeven, and sensitivity. The tool computes net return per acre and the breakeven yield and price, then a sensitivity table shows how that net return swings as price and yield move up or down, so you see the range, not just the point estimate.
What the numbers are based on
A crop budget is only trustworthy if you can see where each figure came from. Here the defaults are named federal data, not house assumptions:
- Costs: USDA ERS Commodity Costs & Returns, the federal cost-of-production series covering seed, fertilizer, chemicals, fuel, repairs, and operating costs by crop and region.
- Price: USDA NASS pricing for the crop, adjusted toward your local cash price with USDA AMS state cash bids and basis so the revenue line reflects your state's cash market, not a national average.
- Yield: your input, because you know your fields; NASS county yields are available as a sanity check.
Two concrete examples of what the output looks like (illustrative, not a quote for your ground): a corn budget might total roughly $820/acre in costs against $960/acre revenue at 200 bu and $4.80, a $140/acre net return with a breakeven near 171 bu. Nudge the price to $4.30 in the sensitivity table and that same budget slips to roughly breakeven, the kind of swing that’s far easier to plan around when you can see it before planting.
A worked example
A 220-acre field in Champaign County, Illinois. The operator is deciding between continuous corn and a corn-soybean rotation. Building both budgets side by side, the corn scenario carries higher input costs (more nitrogen, more seed) but also higher gross revenue; the soybean scenario is leaner on both.
With ERS costs pre-filled and the operator’s own fertilizer and seed prices swapped in, the two net-return-per-acre figures come out closer than expected. The deciding factor turns out to be the sensitivity table: the corn budget’s net return collapses faster when price drops, while soybeans hold up. For an operator worried about a soft price year, the budget makes the risk visible in dollars per acre rather than gut feel.
Who it’s for
Row-crop farmers pricing a season before the input bill lands, landowners checking whether a cash-rent offer beats farming the ground themselves, and new operators who need a defensible budget for a lender or a landlord. Once you know a field’s cost and return, the farmland use optimizer puts that farming return next to cash rent, CRP, and energy on the same acres.
Frequently asked questions
- Is the crop budget calculator free?
- Building a per-acre budget and running the sensitivity table are free with no account. Saving and reusing scenarios is part of Land Scout. The $89 Decision Report is a separate, optional product that bundles the parcel’s full federal-data analysis into a PDF.
- Do I have to create an account?
- No. You can build and compare budget scenarios without signing up. An email is only needed if you want a report emailed to you.
- What cost and price data does it use?
- The cost side starts from USDA ERS Commodity Costs & Returns (the federal cost-of-production figures for seed, fertilizer, chemicals, fuel, and operations) and the revenue side uses USDA NASS pricing plus USDA AMS state cash bids and basis for a local price. You can override any line with your own actual costs.
- How accurate is the budget?
- It is only as good as its inputs, which is why every default is a named USDA figure you can replace with your own numbers. The point is a defensible starting budget and a clear breakeven, not a promise of a yield or price you’ll actually get.
- Can I compare more than one crop or scenario?
- Yes. You can build multiple scenarios (a corn budget next to soybeans, or the same crop at two price assumptions) and the sensitivity table shows how net return per acre moves as price and yield change.
- Does it work outside the Corn Belt?
- The USDA ERS and NASS data behind it are national, so you can budget a crop for any U.S. county. Coverage of the most granular local basis is strongest where Scout’s parcel data is live and expanding from there.
Related tools
Land-Use Optimizer
Compare every use of your acres, row crops, cash rent, CRP, solar, wind, by modeled return.
farmland use optimizer →Decide
Compare farming, a solar lease, and CRP on 5-year income, capital, reversibility, and risk.
farm vs. solar vs. CRP calculator →Or see all six free farmland tools.
Know the breakeven before you plant.
Build a free per-acre crop budget on any U.S. field: USDA cost defaults, your own overrides, and a sensitivity table in minutes.
Free to start. The full Decision Report is $89.