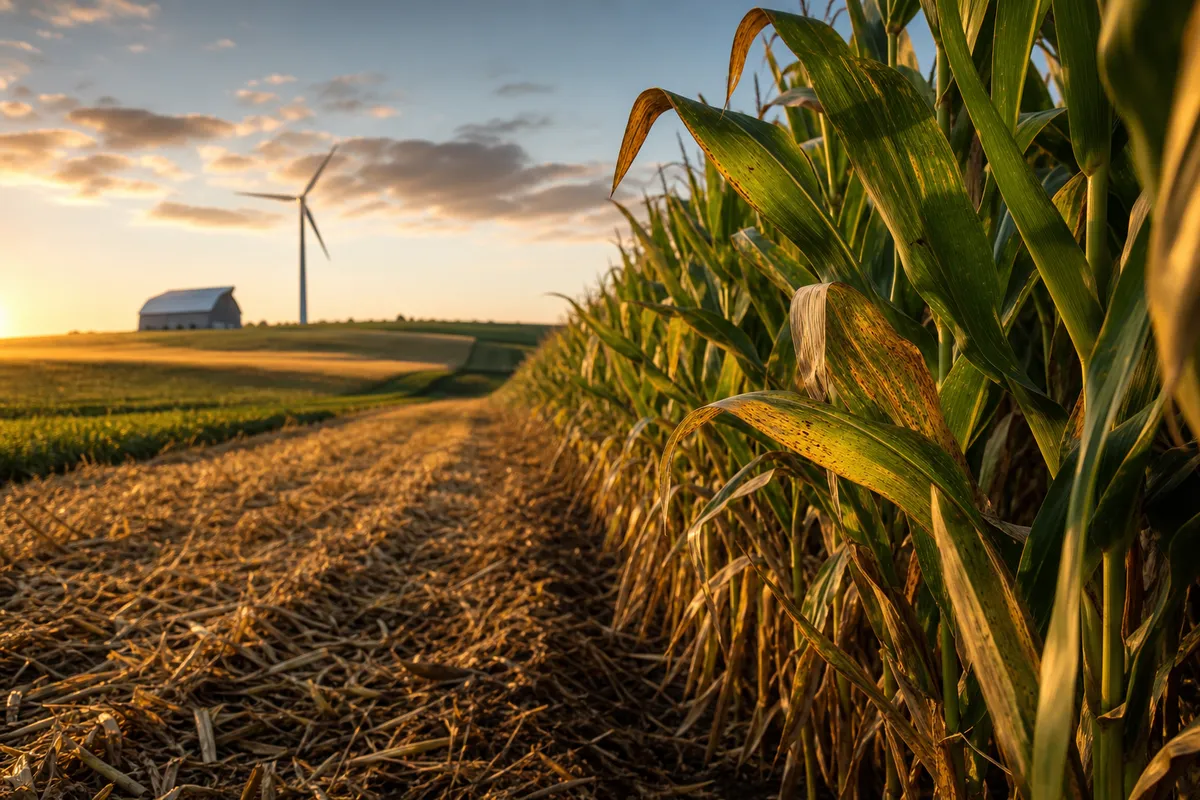
Detecting Late-Season Corn Leaf Diseases During R4-R5: Scouting Northern Corn Leaf Spot and Gray Leaf Spot to Protect Kernel Fill
At R4, the kernel fill race is already underway. Every functional leaf in the upper canopy — ear leaf and above — is contributing directly to the photosynthate supply that determines final kernel…
At R4, the kernel fill race is already underway. Every functional leaf in the upper canopy — ear leaf and above — is contributing directly to the photosynthate supply that determines final kernel weight. When Northern Corn Leaf Spot or Gray Leaf Spot is advancing through that canopy, you're not managing aesthetics. You're managing the duration of the grain fill window. Here's how to scout it accurately, interpret what you're seeing, and make a defensible fungicide decision before the window closes.
Differentiating NCLS from GLS at R4-R5
By dough stage, both diseases may be present in the same field — and in stressed canopies with overlapping symptoms, misidentification is common. Accurate diagnosis drives accurate severity ratings, which drives accurate ROI math.
Northern Corn Leaf Spot (NCLS) lesions caused by Bipolaris zeicola Race 1 present as tan to brown rectangular spots, typically 1–2 cm long, with distinct parallel edges constrained by leaf veins. Under Race 3 pressure, lesions can coalesce into larger, irregular necrotic areas. NCLS tends to initiate in lower canopy leaves and move upward, and it's strongly tied to hybrid susceptibility — if you placed a susceptible hybrid on continuous corn acres with surface residue, NCLS hot spots will cluster there.
Gray Leaf Spot (GLS), caused by Cercospora zeae-maydis, produces narrow, rectangular, grayish-tan lesions with a more diffuse, water-soaked margin early in development — shifting to a characteristic gray cast with visible sporulation under high humidity. GLS lesions are similarly vein-delimited but typically longer (up to 5 cm) and more uniform in width. GLS severity is closely tied to nighttime humidity, minimum temperatures above 60°F, and reduced air movement — meaning low-lying areas, dense canopies, and fields with reduced tillage history typically show the earliest and most severe pressure.
Field differentiation checklist:
- Lesion color: tan-brown (NCLS) vs. gray with sporulation (GLS)
- Lesion length: shorter, more variable (NCLS Race 1) vs. longer, more uniform (GLS)
- Distribution in canopy: NCLS often more uniformly distributed; GLS typically progresses more aggressively in the lower canopy before moving up
- Canopy zone affected at time of scouting: if disease has reached the ear leaf or above at R4, you're in active kernel fill territory
- Hybrid placement records: cross-reference known susceptibility ratings from your seed rep or university trial data
If you're uncertain, submit samples to your state plant diagnostic lab — but don't let diagnostic uncertainty delay your scouting protocol. Severity assessment and canopy mapping can proceed in parallel.
Building a Field Severity Map: Structured Transect Scouting Protocol
Random walk scouting at R4-R5 produces observational impressions, not decision-grade data. A structured transect protocol produces a field severity map you can act on — and document.
Transect setup: For fields up to 80 acres, run a minimum of 5 transects across the field, each penetrating at least 100 feet into the field from the entry point. Avoid field edges for your primary data collection — edge rows frequently overrepresent disease pressure relative to the broader field. In larger fields, increase transect density proportionally or use a grid-based approach anchored to management zones.
At each stop (minimum 10 stops per transect):
- Assess 5 consecutive plants
- Rate disease severity on a 1–9 scale (or percent leaf area affected) for three canopy zones: lower canopy (below ear leaf), ear leaf, and upper canopy (above ear leaf)
- Note hybrid identity if block-planted fields include multiple hybrids
- Flag stops where upper canopy severity exceeds 25% leaf area affected — these are your actionable hot spots
Mapping hot spots to field variables: Once you've completed your transects, overlay your severity data against:
- Hybrid placement boundaries — differential severity between hybrids in the same field is a direct indicator of susceptibility differences and will inform next year's hybrid decisions
- Tillage history — continuous corn with minimal tillage maintains inoculum load; compare severity in those zones against rotated or tilled acres
- Drainage patterns — GLS in particular concentrates in areas with restricted air movement and prolonged leaf wetness; low-lying or poorly drained zones frequently serve as disease foci
This spatial mapping isn't optional — it's what separates a reactive application decision from a precision-agronomic one.
Reading Canopy Senescence: Disease vs. Physiology
This is where experienced eyes matter most, and where scouting reports frequently go wrong. At R4-R5, some degree of lower canopy leaf firing is physiologically normal. The crop is remobilizing nutrients, lower leaves are increasingly shaded, and senescence initiates from the bottom up. Misreading normal physiological senescence as disease pressure can push you toward an application that won't move the needle.
Characteristics of normal physiological senescence at R4-R5:
- Progressive yellowing and browning that initiates in lowest canopy leaves (below ear leaf)
- Uniform coloration across leaf tissue without distinct lesion boundaries
- No sporulation, no water-soaked margins, no tan centers with defined edges
- Upper canopy remains green and photosynthetically active
Characteristics of disease-accelerated leaf death:
- Lesion-driven necrosis rather than uniform yellowing — you can identify discrete lesion margins even as tissue coalesces
- Premature involvement of ear leaf and leaves above it (L1-L3 above ear leaf)
- Rapid spread from one rating to the next within 5–7 days under favorable conditions
- Sporulation visible on lesion surfaces under magnification
Why upper canopy loss matters at R4-R5: The ear leaf and the three leaves above it contribute disproportionately to kernel fill. Research consistently shows that loss of these leaves during active grain fill compresses the effective fill period and reduces final kernel weight — the primary driver of yield in the final stretch. A canopy where disease has reached 50% severity on the ear leaf and moved above it by R4 is losing photosynthetic capacity precisely when demand is highest. That's the agronomic case for intervention — when it exists.
The Fungicide ROI Calculus at R4-R5
Late-season fungicide applications are the most scrutinized call in the corn management calendar. The input cost is fixed; the yield benefit is probabilistic and time-constrained. Here's how to structure the decision.
Four variables that drive the ROI calculation:
1. Days to black layer Estimate GDDs remaining to physiological maturity based on current accumulation and your 30-year average. At R4, you're typically 20–30 days from black layer depending on hybrid maturity and growing conditions. At R5, that window is tightening to 15–20 days. A foliar fungicide applied at R4 with good coverage has a residual window of 14–21 days — potentially covering the remainder of active grain fill. At late R5, residual activity extends past black layer, and you're paying for protection the crop no longer needs.
2. Current severity and trajectory A one-time severity rating is insufficient. You need a trajectory — two ratings 5–7 days apart. A field at 15% upper canopy severity with a disease-favorable forecast is a different decision than a field at 15% severity with dry, warm weather in the outlook. If you're scouting now and haven't established a baseline from 7–10 days ago, that's the first gap to close.
3. Hybrid tolerance rating Your hybrid's disease tolerance rating from university performance trials or the seed company's own data is not an afterthought — it's central to the decision. A hybrid rated moderately susceptible to GLS with 20% ear leaf severity in a high-humidity environment has a fundamentally different risk profile than a moderately resistant hybrid showing similar symptoms. The tolerance rating is your multiplier on trajectory risk.
4. Commodity price threshold At current corn prices, the break-even yield response for a fungicide application (application cost + product cost, typically $25–$40/acre for aerial, $18–$28/acre ground) requires roughly 8–15 bushels per acre of prevented yield loss at $4.50–$5.50/bu corn. Published university fungicide trial data on late-season applications in susceptible hybrids under moderate to high disease pressure shows responses in the 5–20 bu/acre range — heavily influenced by hybrid susceptibility and disease severity at the time of application. In resistant hybrids under light pressure, responses frequently fail to cover cost. Run your own numbers against your actual input cost and current cash bids.
The short version of the decision framework:
- High susceptibility hybrid + upper canopy severity >25% + trajectory trending up + R4 timing + favorable disease weather = application likely pencils out
- Moderate resistance hybrid + lower canopy pressure only + R5 or later + dry forecast = application likely does not pencil out
- Everything in between requires the full calculation with your actual cost and price inputs
Translating Scouting Data Into Durable Field Records
The scouting you do in the next two to three weeks has value beyond this season's fungicide decision. A structured field record from R4-R5 scouting creates a three-way payoff:
Hybrid selection for next season: Documenting disease severity by hybrid within your own fields — under your actual management conditions, your local inoculum pressure, your tillage system — is more actionable than university trial data from a different county. If a hybrid you planted shows consistently higher GLS severity than a neighbor hybrid in the same field, that's a selection signal. Record it now while the evidence is visible and quantifiable.
Fungicide timing optimization: Knowing that a specific field hit threshold severity at R4 this year tells you where to set your scouting calendar next season. Early-season scouting data combined with a late-season severity record gives you a disease progression timeline you can use to time R1-R2 applications more precisely — when the ROI case is typically much stronger.
Crop insurance documentation: If yield drag is attributable to foliar disease, you need contemporaneous field records — dated, geo-referenced, quantified. A narrative scouting report written after the combine runs carries far less weight than structured field records captured during the growing season with severity ratings, photographs, and transect data. If you're in a situation where late-season disease pressure is significant, start building that documentation now.
The Bottom Line
At R4-R5, you're operating in the final functional window for managing foliar disease impact on this year's yield. The biology is time-constrained, the ROI math is specific to your hybrid and your cost structure, and the scouting data you generate now has compounding value across multiple future decisions.
Scouting isn't the precursor to the decision — it is the decision, executed in the field with a protocol rigorous enough to support the numbers.
Download the Agriterra Scout late-season corn disease severity rating worksheet and log your R4-R5 scouting observations by field zone — then use the built-in fungicide decision threshold calculator to determine whether an application pencils out before your crop reaches black layer.
Frequently asked
What is the difference between Northern Corn Leaf Spot and Gray Leaf Spot lesions?
NCLS produces tan to brown rectangular spots (1–2 cm) with distinct parallel edges, initiated in lower canopy leaves. GLS produces longer (up to 5 cm), more uniform rectangular lesions with grayish-tan color and water-soaked margins early on, shifting to gray with visible sporulation. GLS is tied to humidity and reduced tillage areas.
Why does late-season corn leaf disease management matter at R4-R5?
At R4, kernel fill is underway and every functional upper canopy leaf contributes directly to photosynthate supply determining final kernel weight. Late-season leaf diseases reduce the duration of the grain fill window, making accurate disease identification and fungicide decisions critical before the window closes.
What environmental conditions favor Gray Leaf Spot development?
GLS severity is closely tied to nighttime humidity, minimum temperatures above 60°F, and reduced air movement. Low-lying areas, dense canopies, and fields with reduced tillage history typically show the earliest and most severe GLS pressure.
Go deeper: the reference guides
- What farmland produces Yields and income per acre, from public data.
- What crops grow in Indiana? Indiana crop acres from USDA NASS.
- What crops grow in Ohio? Ohio crop acres from USDA NASS.
See what your acres could earn
Start with a free parcel read: soil, water, flood, and what the ground could earn farmed, rented, enrolled or leased. When a decision is worth it, the Decision Report is $89 once for one parcel, or 5 a month with Land Scout at $39 a month.
Launch Scout